Authors:
(1) Aarav Patel, Amity Regional High School – email: aarav.dhp@gmail.com;
(2) Peter Gloor, Center for Collective Intelligence, Massachusetts Institute of Technology and Corresponding author – email: pgloor@mit.edu.
Table of Links
- Abstract and Introduction
- Related Works
- Purpose
- Methods
- Results
- Discussion
- Conclusion and Bibliography
4. Methods
The creation of this project was divided into three steps. The first step was data collection through web scrapers across various social networks. Afterward, text data was pre-processed and converted into sub-category scores using Natural Language Processing. Finally, machine-learning algorithms were trained using this data to compute a cohesive ESG rating.

4.1. Data Collection
Rather than use self-reported corporate filings, social network data was used to holistically quantify ESG. Social network analysis and web scraping can be used to identify trends (Gloor et al., 2009). Popular social networks such as Twitter, LinkedIn, and Google News have a plethora of data pertaining to nearly any topic. This data can provide a balanced view of company ESG practices, and it can help cover both short-term and long-term company ESG trends. It can also gather data that might not be reflected in filings. Finally, this data can directly highlight the concerns of outsiders, which can better guide company ESG initiatives to be more impactful.

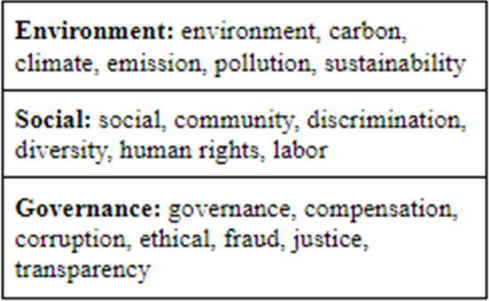
To do this, a comprehensive list of ESG-relevant keywords was created (figure 3). This list of keywords was inspired by sub-categories commonly used in current ESG rating methodologies. This list was used to help collect publicly available company data from Wikipedia, LinkedIn, Twitter, and Google News. To collect data, web scrapers were developed in Python. Wikipedia data was collected using the Wikipedia Application Programming Interface (API). Wikipedia serves to give a general overview of a company’s practices. Google News data was collected by identifying top news articles based on a google search. The links to these articles were stored. The news serves to give overall updates on notable ESG developments. Twitter data was collected with the help of the Snscrape library. Snscrape is a lightweight API that allows users to collect near unlimited Tweets (with certain restrictions on how many can be collected per hour) from almost any timeframe. Twitter was chosen to primarily give consumer-sided feedback on a company’s practices. Since the LinkedIn API does not support the collection of LinkedIn posts, an algorithm was created from scratch to do so instead. The algorithm utilized the Selenium Chromedriver to simulate a human scrolling through a LinkedIn query. Based on this, each post’s text was collected and stored using HTML requests via BeautifulSoup. LinkedIn serves to provide more professional sided information on a company’s practices. This data collection architecture allows for ratings to be refreshed and generated in real time as needed. Afterward, data for each sub-category was stored in a CSV file.
These four social networks cover a wide range of company ESG data. Data was collected for most S&P 500 companies (excluding real estate). Real estate was excluded primarily because it did not receive as much coverage pertaining to ESG issues (based on surface-level analysis), so it did not seem viable for the proposed system. This ensures the collected companies were well balanced across sectors and industries. The web scrapers attempted to collect ~100 posts/articles for each keyword on a social network. However, sometimes less data would be collected because of API rate limits and limited data availability for the lesser-known companies. In order to speed up collection, multiple scripts were run simultaneously. At first, the programs would often get ratelimited for collecting so much data in such a short timeframe. To resolve this, safeguards were added to pause the program in case it encountered this. All data collection was done following each site’s terms and conditions. In total, approximately ~937,400 total data points were collected across ~470 companies, with an average of ~37 points per social network keyword. Most of this data was concentrated in 2021. However, a hard date range was not imposed because it would remove data points for lesser-known companies that already struggled to gather enough information.
Once all data was collected, it was exported onto a spreadsheet for further analysis. Data was preprocessed using RegEx (Regular Expressions). First, URLs and links were removed. Mentions were replaced with a generic word to abstractify names. Finally, Uncommon characters and punctuation were removed. This helped filter out words/characters that might interfere with NLP analysis.
4.2. NLP Analysis
After the data was cleaned and organized, an NLP algorithm was built for analysis. Firstly, an ESG relevancy algorithm was created to filter out ESG irrelevant data that might obstruct results. To do this, keyword detection was used to see if the post/article discussed the current company as well as one or more of the ESG sub-categories. Next, Python’s Natural Language Toolkit (NLTK) Named Entity Recognition library was used to determine if a post related to the organization in order to remove unintended data. For example, if the query “apple climate” was searched, then a post might come up saying “Spring climate is the best time to grow apple trees.” However, Named Entity Recognition would be able to identify that this sentence is not ESG relevant since “Apple” is used as an adjective. Therefore, the algorithm will disregard it from the analysis. On the other hand, if the post said, “Apple is pouring 500 million dollars into initiatives for climate change,” then the algorithm would determine that the post is talking about Apple the organization. This filtration step helps remove irrelevant information to improve data quality.
After filtration, NLP sentiment analysis was used to score whether a post was ESG positive or negative. Two NLP algorithms were created to do this: the short-post NLP algorithm analyzed shorter bodies of text (Tweets, LinkedIn posts) while the long-article NLP algorithm analyzed longer ones (News articles, Wikipedia articles).
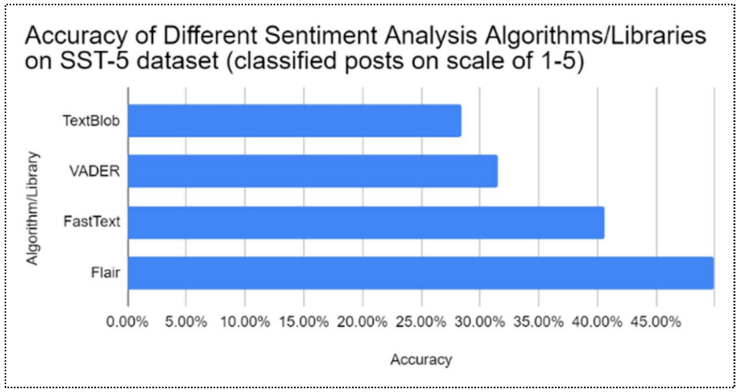
A literary analysis of different Python sentiment analysis libraries was carried out. After comparing various sentiment analysis libraries such as TextBlob, VADER, FastText, and Flair, it was found that Flair outperformed the other classifiers. This is likely because the simple bag-ofwords classifiers, such as VADER or TextBlob, failed to identify the relations that different words had with each other. On the other hand, Flair used contextual word vectors to analyze a sentence’s word-level and character-level relationships. This is likely why, when these algorithms were tested on the Stanford Sentiment Treebank (SST) to rate movie review sentiment on a scale of 1-5, it was found that the Flair algorithm performed the best with an F1 score of 49.90% (Akbik et al., 2018) (Rao et al., 2019) (figure 4). So, the short-post algorithm was built using the Flair sentiment analysis library. The long-article algorithm is essentially the short-post algorithm but averaged across all relevant body paragraphs (i.e., paragraphs containing the company name) in an article.

These umbrella algorithms were further optimized for each specific social network. For example, the LinkedIn algorithm analyzed the author’s profile of a LinkedIn post to eliminate selfreporting. This is because executives often discuss their positive initiatives and goals, which can dilute other unbiased observations and thus construe results. Additionally, for the Twitter and LinkedIn algorithms, if a link address was found within the text, then the algorithm would analyze that article for evaluation.
Initially, the analysis algorithm was very slow since it would take Flair 3-4 seconds to analyze one post. So, a variation called “Flair sentiment-fast” was installed. This allowed Flair to conduct batch analysis where it analyzes multiple posts simultaneously. This significantly cut down on analysis time while slightly sacrificing accuracy.
Once all raw data was scored, the scores were averaged into a cohesive spreadsheet. Mean imputing was used to fill in any missing sub-score data. These sub-category scores can provide executives with breakdowns of social sentiment on key issues, giving them concrete information Figure 4: Comparison of accuracy of different sentiment analysis algorithms on SST-5 database about which areas to improve. These scores can be used raw to help guide initiatives, or they can be compiled further through machine learning to provide an ESG prediction
4.3. Machine Learning Algorithms
After compiling the data, different machine-learning models were tested. The goal of these models was to predict an ESG score from 0-100, with 0 being the worst and 100 being the best. Most of these supervised learning models were lightweight regression algorithms that can learn non-linear patterns with limited data. Some of these algorithms include Random Forest Regression, Support Vector Regression, K-Nearest Neighbors Regression, and XGBoost (Extreme Gradient Boosting) Regression. Random Forest Regression operates by constructing several decision trees during training time and outputting the mean prediction (Tin Kam Ho, 1995). Support Vector Regression identifies the best fit line within a threshold of values (Awad et al., 2015). K-Nearest Neighbors Regression predicts a value based on the average value of its neighboring data points (Kramer, 2013). XGBoost (Extreme Gradient Boosting) Regression uses gradient boosting by combining the estimates/predictions of simpler regression trees (Chen et al., 2016).
These regression algorithms were trained using 19 features. These features include the average sentiment for each of the 18 keywords with an additional category for Wikipedia. They were calibrated to public S&P Global ESG ratings to ensure they did not diverge much from existing solutions. A publicly licensed ESG rating scraper on GitHub was used to retrieve S&P Global ESG scores for all companies that were analyzed (Shweta-29). Optimization techniques such as regularization were used to prevent overfitting for greater accuracy.
Before creating the algorithms, companies with less than 5 articles/posts per ESG subcategory were filtered out. This left ~320 companies for analysis. In order to create and test the algorithm, ~256 companies were used as training data, while ~64 companies were used for testing data. These results were used to determine the predictive capabilities of the algorithm.
This paper is available on arxiv under CC BY-NC-ND 4.0 DEED license.

